


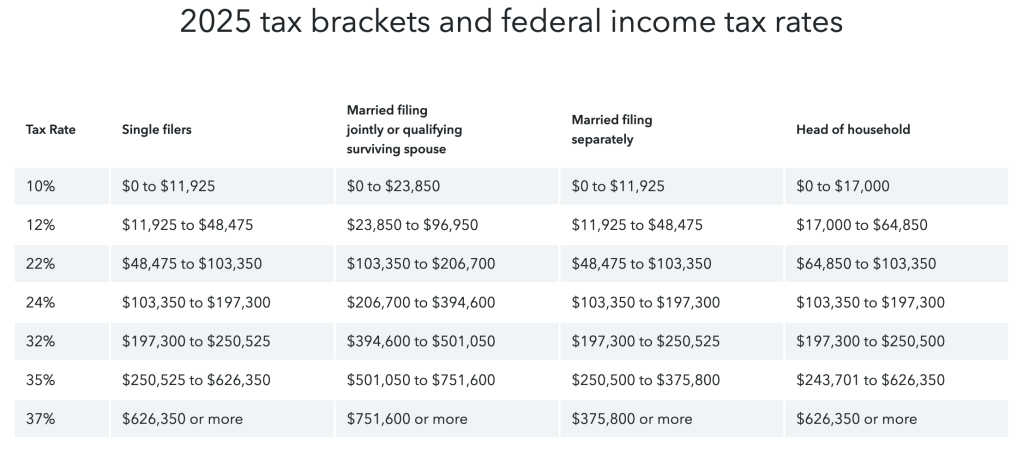
It’s tax season, and many of you may be wondering if Trump’s One Big Beautiful Bill increases or decreases wealth inequality in the United States. Let’s throw some light on that question by looking at the 2025 tax brackets.
Here are the 2025-2026 tax brackets:
Wealth inequality does not entirely depend on income tax brackets. Income, savings, assets/investments, gifts, inheritance, property, tax laws/loopholes, and money laundering all directly contribute to wealth with education, skills/abilities, opportunities, and other factors indirectly contributing. I cannot analyze all of the biopsychosocial, geopolitical, and economic factors that may directly or indirectly contribute to total wealth.
But can I answer some simple questions like, What is the estimated net income range based on these tax brackets?
| Filing Status | 2025 Deduction | 2026 Deduction |
| Single | $15,750 | $16,100 |
| Married Filing Jointly | $31,500 | $32,200 |
| Head of Household | $23,625 | $24,150 |
To get these numbers, we need to subtract the standard deduction from our gross income prior to using the tax brackets to estimate a net income…
2025 Estimated Tax Comparison (Single Filers):
| Gross Income | Standard Deduction | Taxable Income | Tax Liability | Estimated Net Income | Top Tax Bracket |
| $30,000 | $15,750 | $14,250 | $1,472 | $28,528 | 12% |
| $50,000 | $15,750 | $34,250 | $3,872 | $46,128 | 12% |
| $75,000 | $15,750 | $59,250 | $7,950 | $67,050 | 22% |
| $100,000 | $15,750 | $84,250 | $13,450 | $86,550 | 22% |
| $150,000 | $15,750 | $134,250 | $25,067 | $124,933 | 24% |
| $250,000 | $15,750 | $234,250 | $52,031 | $197,969 | 32% |
| $500,000 | $15,750 | $484,250 | $139,185 | $360,815 | 35% |
| $1,000,000 | $15,750 | $984,250 | $321,193 | $678,807 | 37% |
People who make more income before taxes have higher net incomes after taxes. The government is not going to force you into a lower tax bracket or elevate you into a higher one. That seems fair. It’s not rocket science.
According to the United States House Committee on Ways and Means (Smith et al., 2025), the “One, Big, Beautiful Bill” (OBBBA), also known as House Bill H.R. 1, 119th Congress, “…increases American families’ income and workers’ wages”. But does House Bill H.R.1 (119th Congress) or OBBBA, increase the total wealth of lower and middle classes more than the upper class: probably, maybe, or probably not? Let’s compare 2025 and 2026 tax brackets…
Here are estimated net incomes after taxes (including the standard deduction) by Federal tax bracket for Single Filers (2025 vs. 2026) & Married Filing Jointly (2025 vs. 2026)…
Net Income Comparison (2025 vs. 2026):
| Gross Income | 2025 Net (Single) | 2026 Net (Single) | 2025 Net (MFJ*) | 2026 Net (MFJ*) |
| $40,000 | $37,329 | **$37,380** | $39,150 | **$39,220** |
| $75,000 | $67,051 | **$67,330** | $70,257 | **$70,360** |
| $125,000 | $105,933 | **$106,267** | $114,257 | **$114,360** |
| $250,000 | $197,977 | **$198,696** | $211,866 | **$212,532** |
| $500,000 | $360,965 | **$361,866** | $395,954 | **$397,392** |
| $1,000,000 | $678,807 | **$679,999** | $717,593 | **$719,750** |
| *MFJ = Married Filing Jointly |
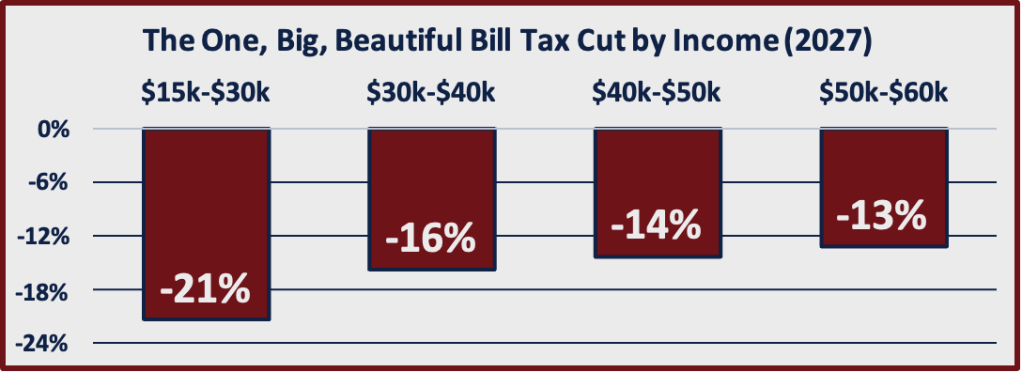
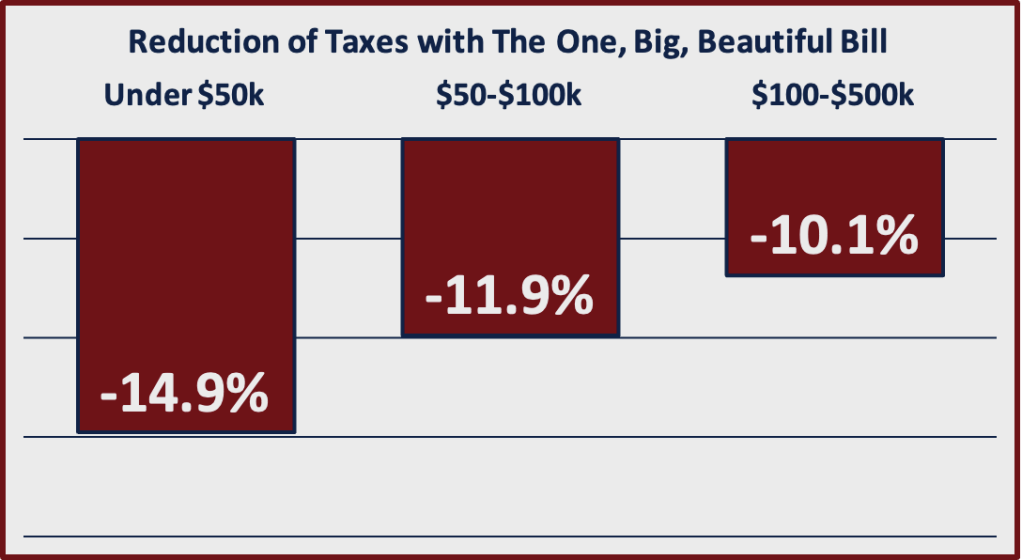
Now let’s see how the stated One Big Beautiful Bill Tax Cuts by Income (2027) match the estimated changes in net income after Federal taxes between 2025 and 2026:
Comparison of Net Income (2025 vs. 2026) with Estimated Tax Cut % per Fact Sheet (Smith, 2025):
| Gross Income | 2025 Net Income | 2026 Net Income | Estimated Tax Cut % (per Fact Sheet) |
| $25,000 | $24,075 | **$24,130** | 23.0% Cut (Largest of any group) |
| $45,000 | $41,728 | **$41,804** | 16.5% Cut |
| $75,000 | $67,051 | **$67,374** | 12.0%+ Cut |
| $150,000 | $124,933 | **$125,314** | Pro-Growth Relief |
| $500,000 | $360,965 | **$361,936** | 70% of cuts benefit <$500k |
| $1,500,000+ | $993,807 | **$995,074** | Tax Burden Increases (Top 1% pay more) |
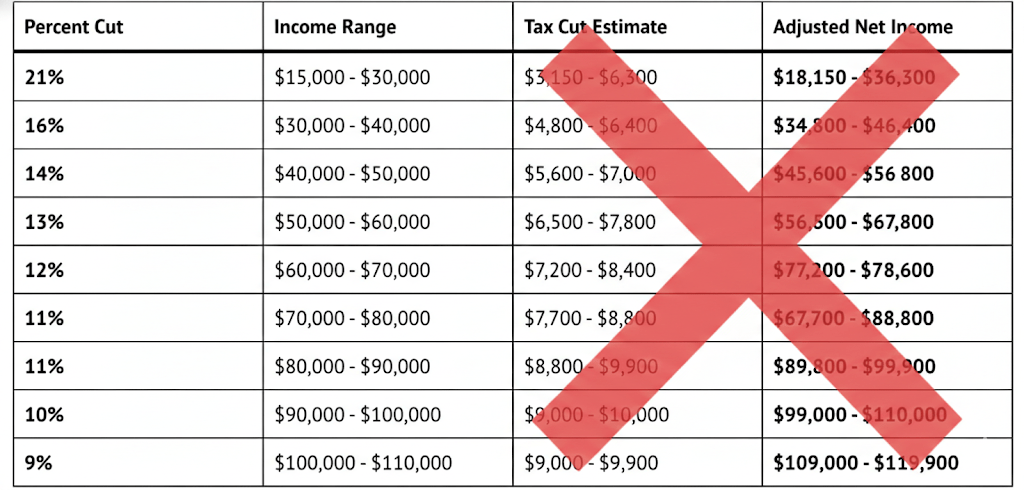
This is how I initially interpreted the Smith’s (2025) pdf. It is the only chart in this post that I did not use Google Gemini for. And, I appear to have totally misinterpreted the meaning of The United States House Committee on Ways and Means (Smith et al., 2025) fact sheet because (1) I subtracted instead of added my estimated tax cut, and (2) I am pretty sure I grossly misinterpreted the percentage cited in Smith’s (2025) fact sheet…
| OBBB Tax Cut by Income | e.g. 0.21 * 15,000 = 3150 | e.g. 0.21 * 30,000 = 6300 | |
| Percent Cut | Income Range | Tax Cut Estimate | Net Income |
| 21% | $15,000-$30,000 | ||
| 16% | $30,000-$40,000 | ||
| 14% | $40,000-$50,000 | ||
| 13% | $50,000-$60,000 |
The United States House Committee on Ways and Means (Smith et al., 2025) states the largest percentage tax cut by income goes to the lower classes. But 21% of what? What is that 21% a percentage of total (i.e. gross) income or a percentage of total U.S. tax dollars? When we multiply the percentage by the income range, what tax cut estimate do we get? When we add that tax cut estimate from income, what net income do we get?
Still wrong. That would be a great increase in income, but I’m not seeing that reflected in the spread sheets Google Gemini is producing… . Will someone help me understand what I’m looking at?
| Gross Income Bracket | 2025 Net Income | 2026 Net Income | 2027 Net Income (Proj.) | OBBB Fact Sheet Tax Cut % |
| $15k – $30k | $24,075 | $24,110 | $24,155 | 23.0% Cut (Largest Group) |
| **$30k – $50k** | $41,728 | $41,780 | $41,840 | 16.5% Cut |
| **$50k – $100k** | $67,051 | $67,330 | $67,570 | 13.0% Cut |
| **$100k – $250k** | $124,933 | $125,266 | $125,572 | Pro-Growth Relief |
| **$250k – $500k** | $360,965 | $361,866 | $362,866 | Lower Effective Rate |
| **$1M+ (Top 1%)** | $993,807 | $995,000 | $996,354 | Tax Share Increases |
If these numbers from the United States House Committee on Ways and Means (Smith et al., 2025) are correct, this chart demonstrates that (1) the percentages listed are probably a percentage of total tax dollars NOT a percentage of your tax dollars, and (2) net income continues to increase at a faster rate in higher income brackets. In other words, the “One Big Beautiful Bill” is doing very little, if anything, to reduce income inequality in the United States…
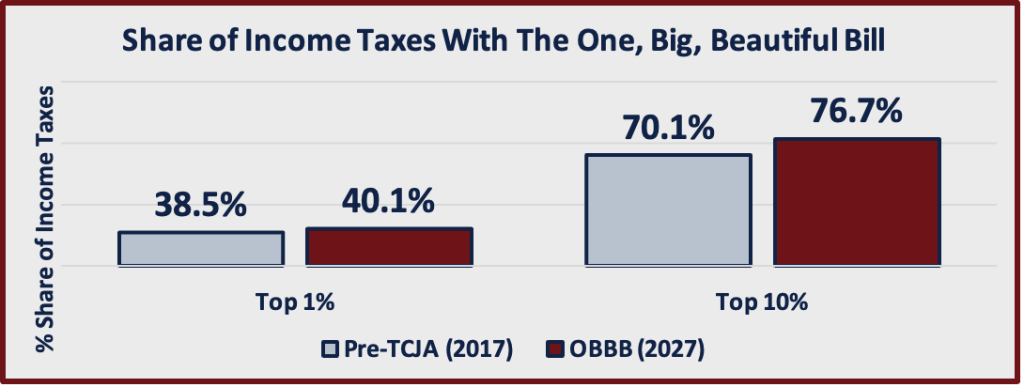
If these charts are a percentage of total tax dollars, they are NOT reflecting individual discounts. Rather, they are more reflective of the population sizes and overall wealth accumulation within these tax brackets.
So, does the One Big Beautiful Bill increase the total wealth of low and middle class Americans more than upper class citizens in the United States? My gut (system 1, fast thinking) tells me probably not. But my cortex (system 2, slow thinking) faculties are telling me maybe?… System 1 is irritated that system 2 knows so little about the U.S. tax code… So, I will remain skeptical of the beauty of these tax cuts while admitting my ignorance.
P.S. Please, someone, help me better understand how to interpret these numbers! I want to know the jist of what is going on here. But this apparently overly-complicated and confusing tax code is giving me a headache…
Sincerely,
System 2 (the slow-thinking system)
Sources:
H.R.1 – An Act to provide for reconciliation pursuant to Title II of H. Con. Res. 14. (2025). In https://www.congress.gov/. U.S. Congress. Retrieved January 31, 2026, from https://www.congress.gov/bill/119th-congress/house-bill/1/text
Turbo Tax Expert. Taxes 2025-2026: One big Beautiful Bill Act Tax law changes and how that impacts you. TurboTax Tax Tips & Videos. https://turbotax.intuit.com/tax-tips/general/taxes-2021-7-upcoming-tax-law-changes/L3xFucBvV
United States House Committee on Ways and Means, & Smith, J. (2025). The one, big, beautiful bill delivers biggest wins for the working class. In https://waysandmeans.house.gov/. Retrieved January 26, 2026, from https://waysandmeans.house.gov/wp-content/uploads/2025/07/Correcting-the-Record-Tax-Bill-Benefits-Working-Class.pdf
Google Gemini
To provide the comparisons and tax calculations for 2025, 2026, and 2027, [Google Gemini] utilized the following official government sources and independent tax analysis websites.
These documents cover the IRS’s official 2025 rates as well as the legislative changes introduced by “The One Big Beautiful Bill” (OBBB).
Official Legislative & Policy Sources
- House Committee on Ways and Means:
- Fact Sheet: The One, Big, Beautiful Bill Delivers Biggest Wins for the Working Class
- Used for: The specific percentage cuts (23% for $15k–$30k earners, etc.) and the “take-home pay” projections.
- The One, Big, Beautiful Bill – Section-by-Section Summary
- Used for: Identifying the permanent standard deduction boost ($15,750 for Single filers) and the new deductions for tips and overtime.
- Correcting the Record: Tax Bill Benefits for Working Class (PDF)
- Used for: Visual data points regarding the 16.5% cut for those under $50,000 and the top 1% tax share.
- Fact Sheet: The One, Big, Beautiful Bill Delivers Biggest Wins for the Working Class
- Internal Revenue Service (IRS):
- Revenue Procedure 2024-40 (2025 Tax Year)
- Used for: Defining the official 2025 tax brackets (10%, 12%, 22%, etc.) and income thresholds.
- IRS Publication 17 (Your Federal Income Tax)
- Used for: General rules on standard deductions and taxable income definitions.
- Revenue Procedure 2025-32 (2026 Adjustments)
- Used for: The inflation-adjusted bracket ranges for the 2026 tax year.
- Revenue Procedure 2024-40 (2025 Tax Year)
Independent Tax Research & Analysis
- Tax Foundation:
- 2025 Tax Brackets and Federal Income Tax Rates
- 2026 Tax Brackets and Federal Income Tax Rates
- Used for: Verifying bracket ranges and the status of the 2017 tax rate extensions.
- TurboTax / Intuit Tax Tips:
- One Big Beautiful Bill Act Tax Law Changes
- Used for: Practical summaries of the Child Tax Credit increase to $2,200 and senior deduction rules.
- One Big Beautiful Bill Act Tax Law Changes
- Senate Committee on Finance:
- OBBB: New Tax Relief Overwhelmingly Benefits Working Class
- Used for: Nonpartisan Joint Committee on Taxation (JCT) distributional analysis of proportional benefits.
- OBBB: New Tax Relief Overwhelmingly Benefits Working Class
